
Tips and Tricks: Using the Dashboard and Reports for Current Information
Below, you'll find recommendations on how you can leverage the Dashboard and Reports for current operational information about the performance of your account.
Note: New Navigator features also produce operational statistics and graphic representations of them. If your organization has Navigator, click here for more information on your trading partners' performance.
-
Determining How Many Trading Partners are Leveraging Conexiom?
-
Proactively Monitor the Progress of Your Automation Goals Over Time
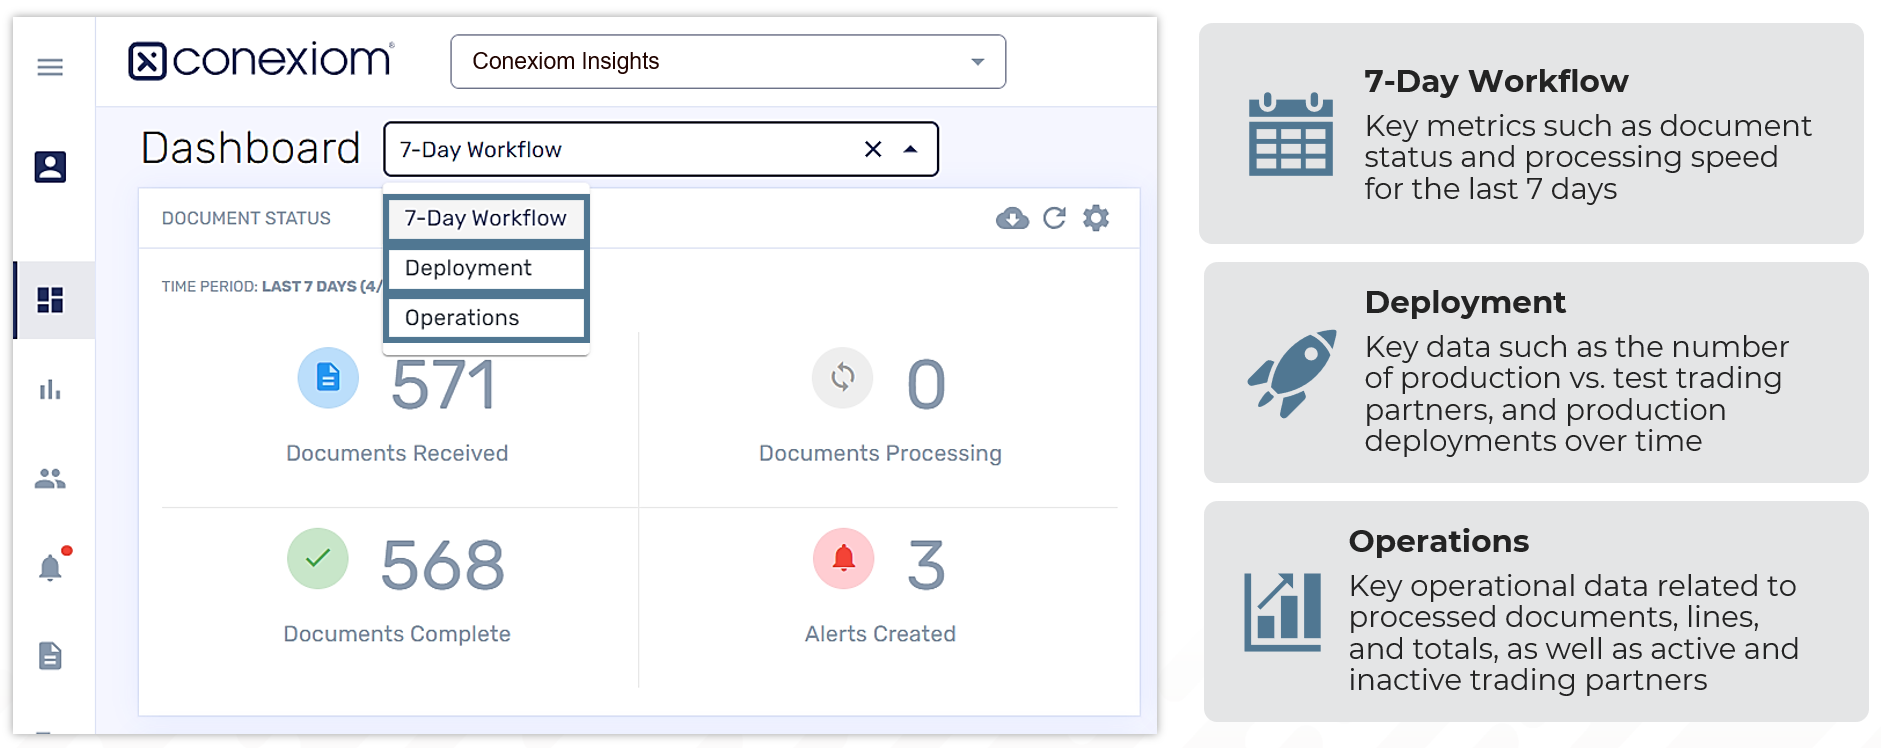
Dashboard tab
Within the Dashboard tab, there are three dashboards that come pre-built with your portal. (To learn more about the Dashboard tab, click here.)
Assign Dashboard access by role to secure confidential KPIs and metrics.
Prebuilt Views
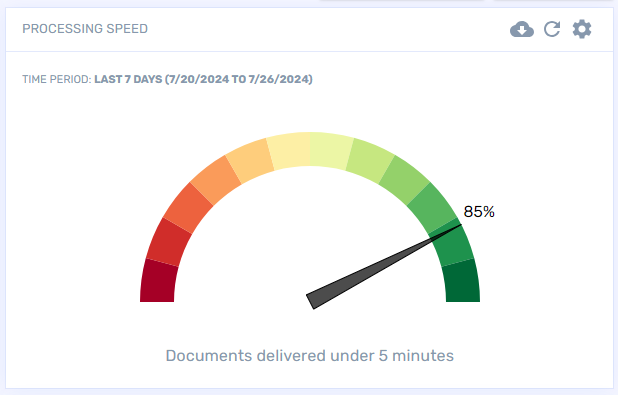
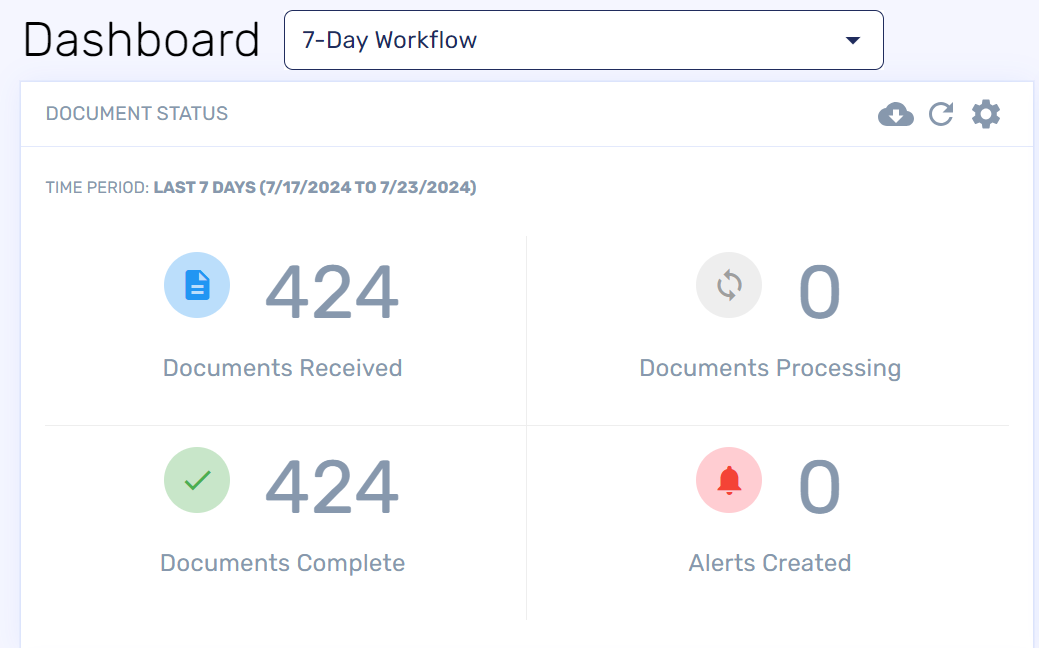
7-Day Workflow Shows Quick Metrics for the Last Seven Days
-
Average processing speed
-
Total document numbers received vs processed
-
Alerts triggered
-
Deployment Focuses on Key Data Relating to Onboarding New Trading Partners
-
# of production vs test
-
Production deployments over time
-
Operations Shows Key Metrics on Utilization of Conexiom
-
Documents and lines processed
-
Top trading partners
-
Inactive trading partners
-
Changing the Timeframe Shown in the Widgets
-
Click Options in the top right.
-
Select Edit from the dropdown.
-
Select your desired range (e.g. Last 90 days, Last Month, etc.)
-
Click Save Changes.
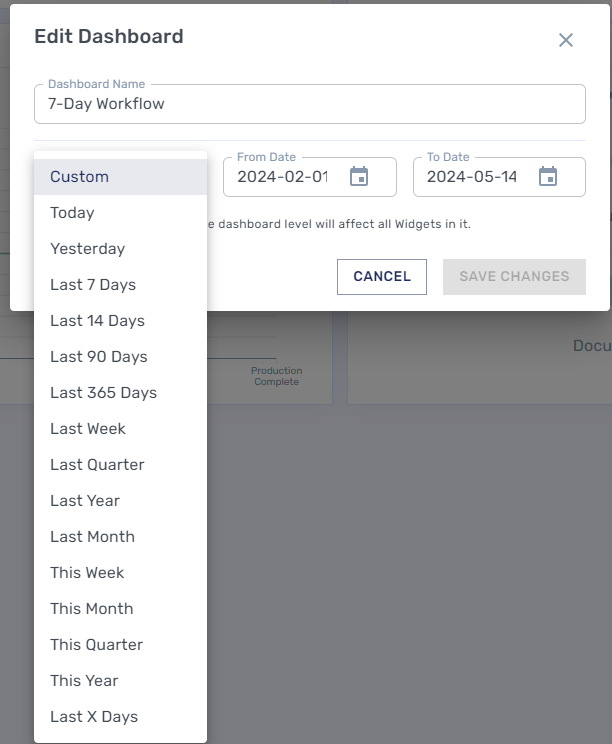
Changing the timeframe with the above steps will change the timeframe for all widgets on the current dashboard.
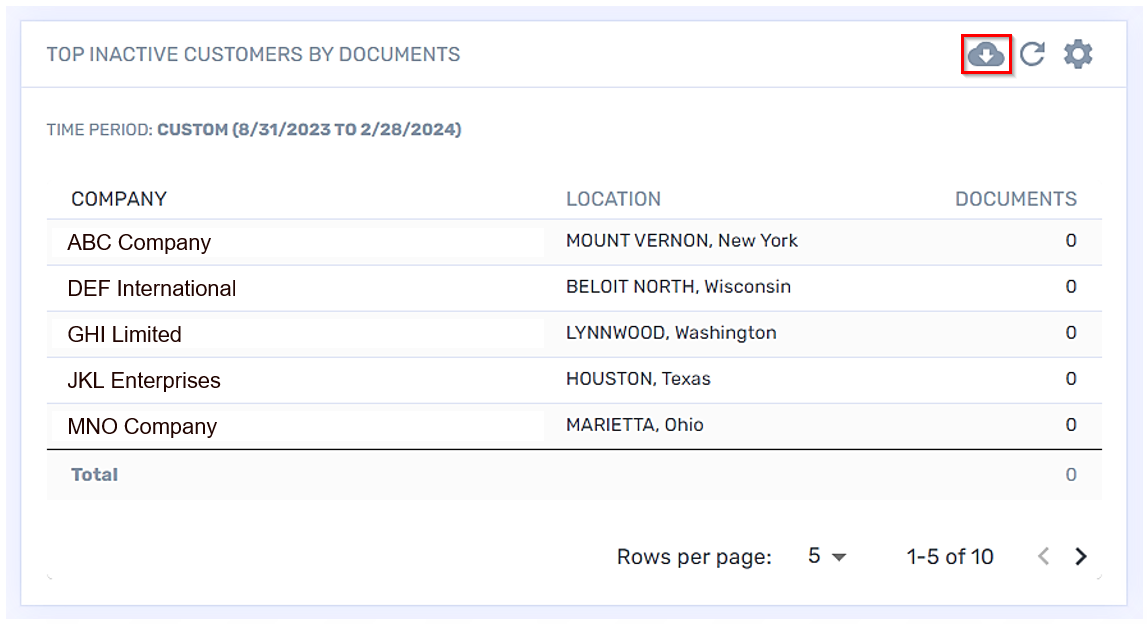
Determine How Many Trading Partners are Leveraging Conexiom
-
Navigate to the Operations Dashboard.
-
View the Top Inactive Customers by Documents widget.
-
Click the Download icon.
-
Compare your list of trading partners who are in production against your Customer's screen.
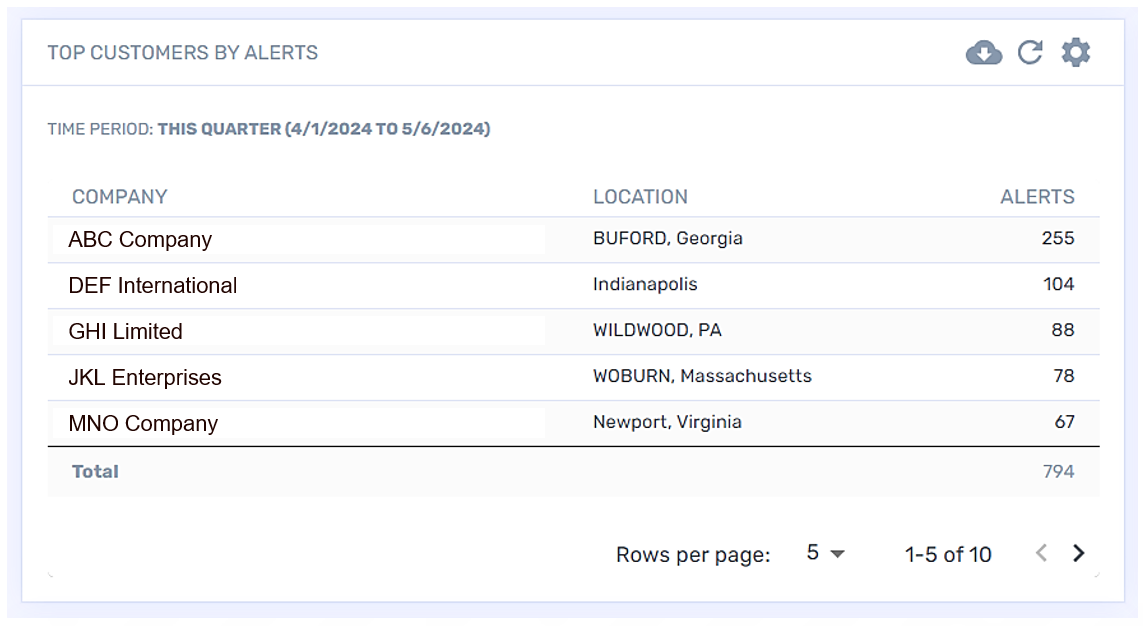
Comparing Alerts vs. Trading partners
-
Navigate to the Operations Dashboard.
-
Compare the Customers by Alerts widget against Top Customers by Documents widget.
-
Pay attention to these considerations:
-
It is common for the Top Customers by Documents to have higher numbers of alerts.
-
If alerts feel significant, are there internal processes that could be implemented to reduce errors before documents come into Conexiom? Examples:
-
If incorrect pricing are triggering exceptions, provide updated pricing list to Customers
-
If a high number of ShipTo / BillTo alerts, provide updated addresses to customers / get the list from the customers
-
If exception manager alerts are high, is Auto Approve enabled?
-
-
Factors that Slow Down Processing Speed
-
Complex logic
-
Multiple XREF look-ups
-
BillTo or ShipTo Alerts
-
Exception Manager Alerts (if applicable)
Using the Document Status widget
The Document Status Widget helps you to examine the following:
-
Shows the comparison between documents Received vs Complete documents
-
Number of Alerts created within the selected timeframe
-
Number of Production Documents processing (Status of "Under Review" or "In Progress").
Proactively Monitor the Progress of Your Automation Goals Over Time
Recommended dashboards to monitor the progress of your automation goals.
Last 30 days Dashboard:
-
Duplicate the existing "Last 7 Days" dashboard
-
Title dashboard as "Last 30 Days"
-
Select period "Last Month" and Save Changes
-
Check in on the dashboard periodically to see trends in your data
Document Processing dashboard
-
Create a new dashboard called "Document Processing"
-
Add 4 "Documents Processed" widgets
-
Update each widget with the following time periods:
-
Last 7 Days
-
Last 30 Days
-
Last 90 Days
-
Last 360 Days
-
Considerations When Reviewing Data
-
Are the trends reflecting what you would expect? (e.g. Seasonal periods, trending up as more trading partners are added, etc.)
-
Trending downwards? (Accounts have changed how they do business? Accounts processed fine previously but now hitting issues, etc.)
Reporting Tab
It allows you display and download different types of reports:
Document Report
List of documents processed through Conexiom across all trading partners for a selected time period.
-
Provides metrics of your documents during this time period
Emails Received
List of all emails sent to Conexiom
-
Like the document report, but shows the Email details
-
Where it came from? Sent to?
-
Unknown customer alerts (which weren't assigned)
-
Helps troubleshoot the question of "Where did my document go? Company name shows as "-""
-
Filter by day/time range when the email would have been received
-
Shows the sender of the email
-
Data can be filtered
-
Exception Manager Updates (Optional)
Shows the list of documents processed through the Exceptions Manager plugin
-
Insight into which documents were automatically approved (System as user) vs. manually approved
-
Not applicable to all portals (Requires Exception Manager plugin)
-
Available upon request
Want to request the Exception Manager report? Please contact support.
Looking for more tips? Check out our on demand webinar https://info.conexiom.com/training-discover-5-actionable-insights .