
Get information in both graphic and reporting forms.
The Dashboard and the Reporting tabs both give you the ability to discover information through various types of reporting.
In addition to operations described here, for recommendations on how you can leverage the Dashboard and Reporting tabs for better trading partner performance, click here.
Note: New Navigator features also produce operational statistics and graphic representations of them. If your organization has Navigator, click here for more information on analyzing your trading partners' performance.
The Dashboard Tab
The Dashboard allows you to access metrics related to your Conexiom account in real time via curated graphs and widgets. Like the Reporting tab, it’s a source of information on your operations.
The Dashboard Tab can act as the landing page, depending on your User Role and portal configurations.
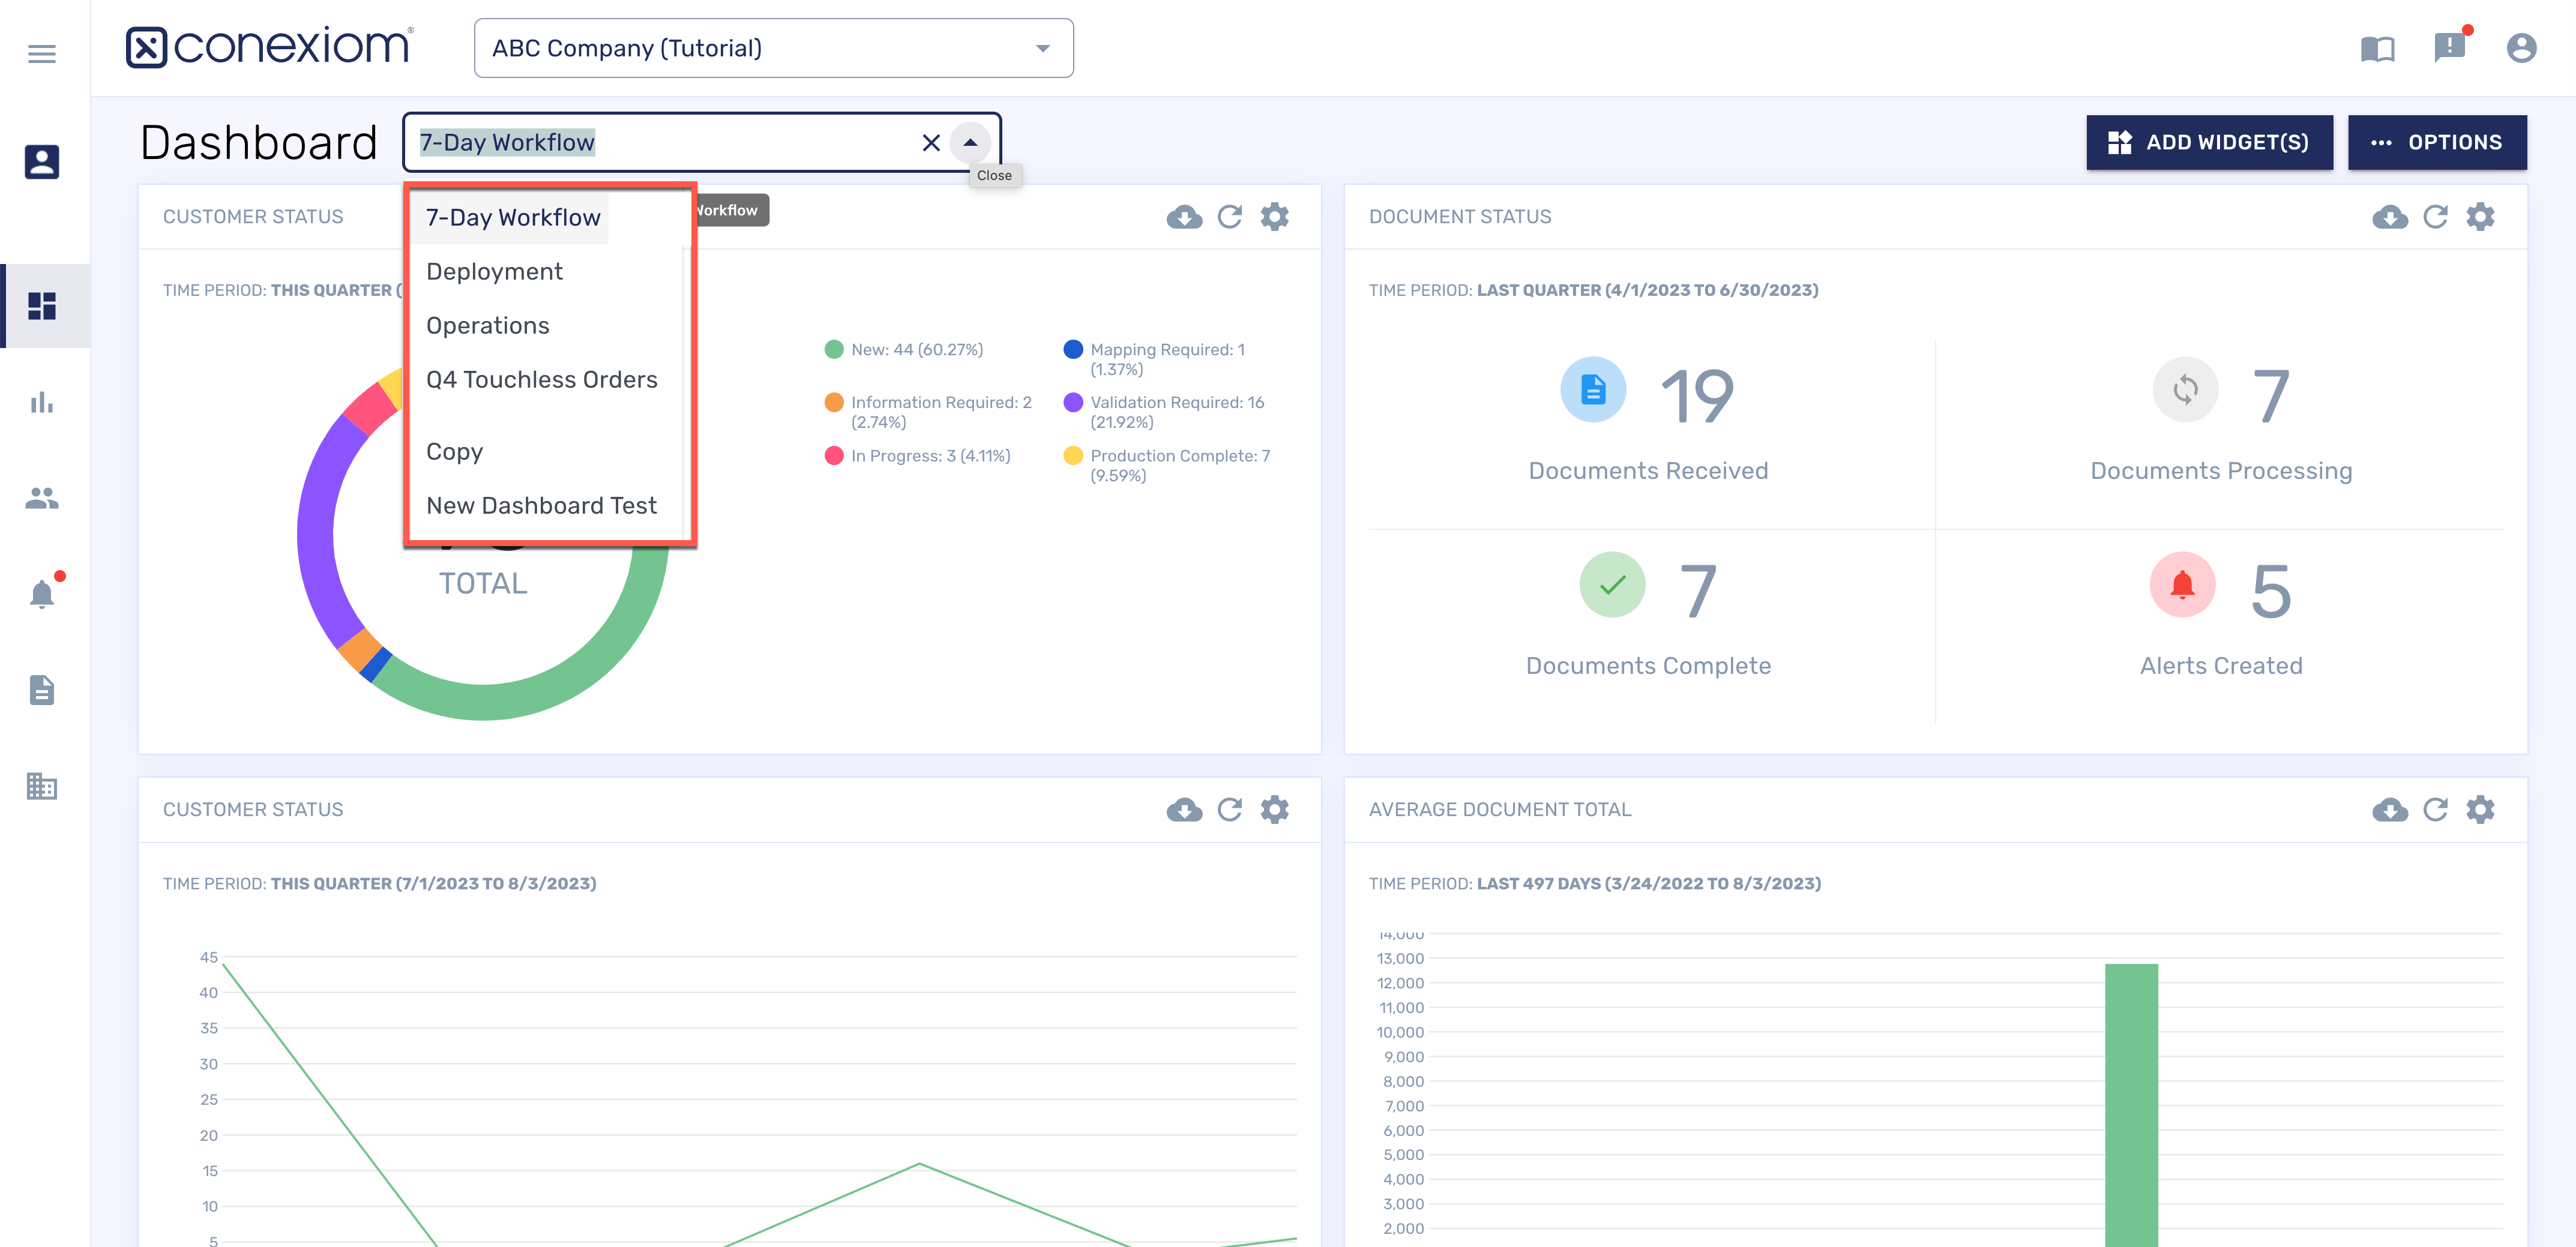
From the Dashboard drop-down menu in the upper left of your screen, you can select the dashboard you want to view. As you add dashboards with different configurations and widgets, they are added as listings on this menu.
Graphs, Widgets, and Panels
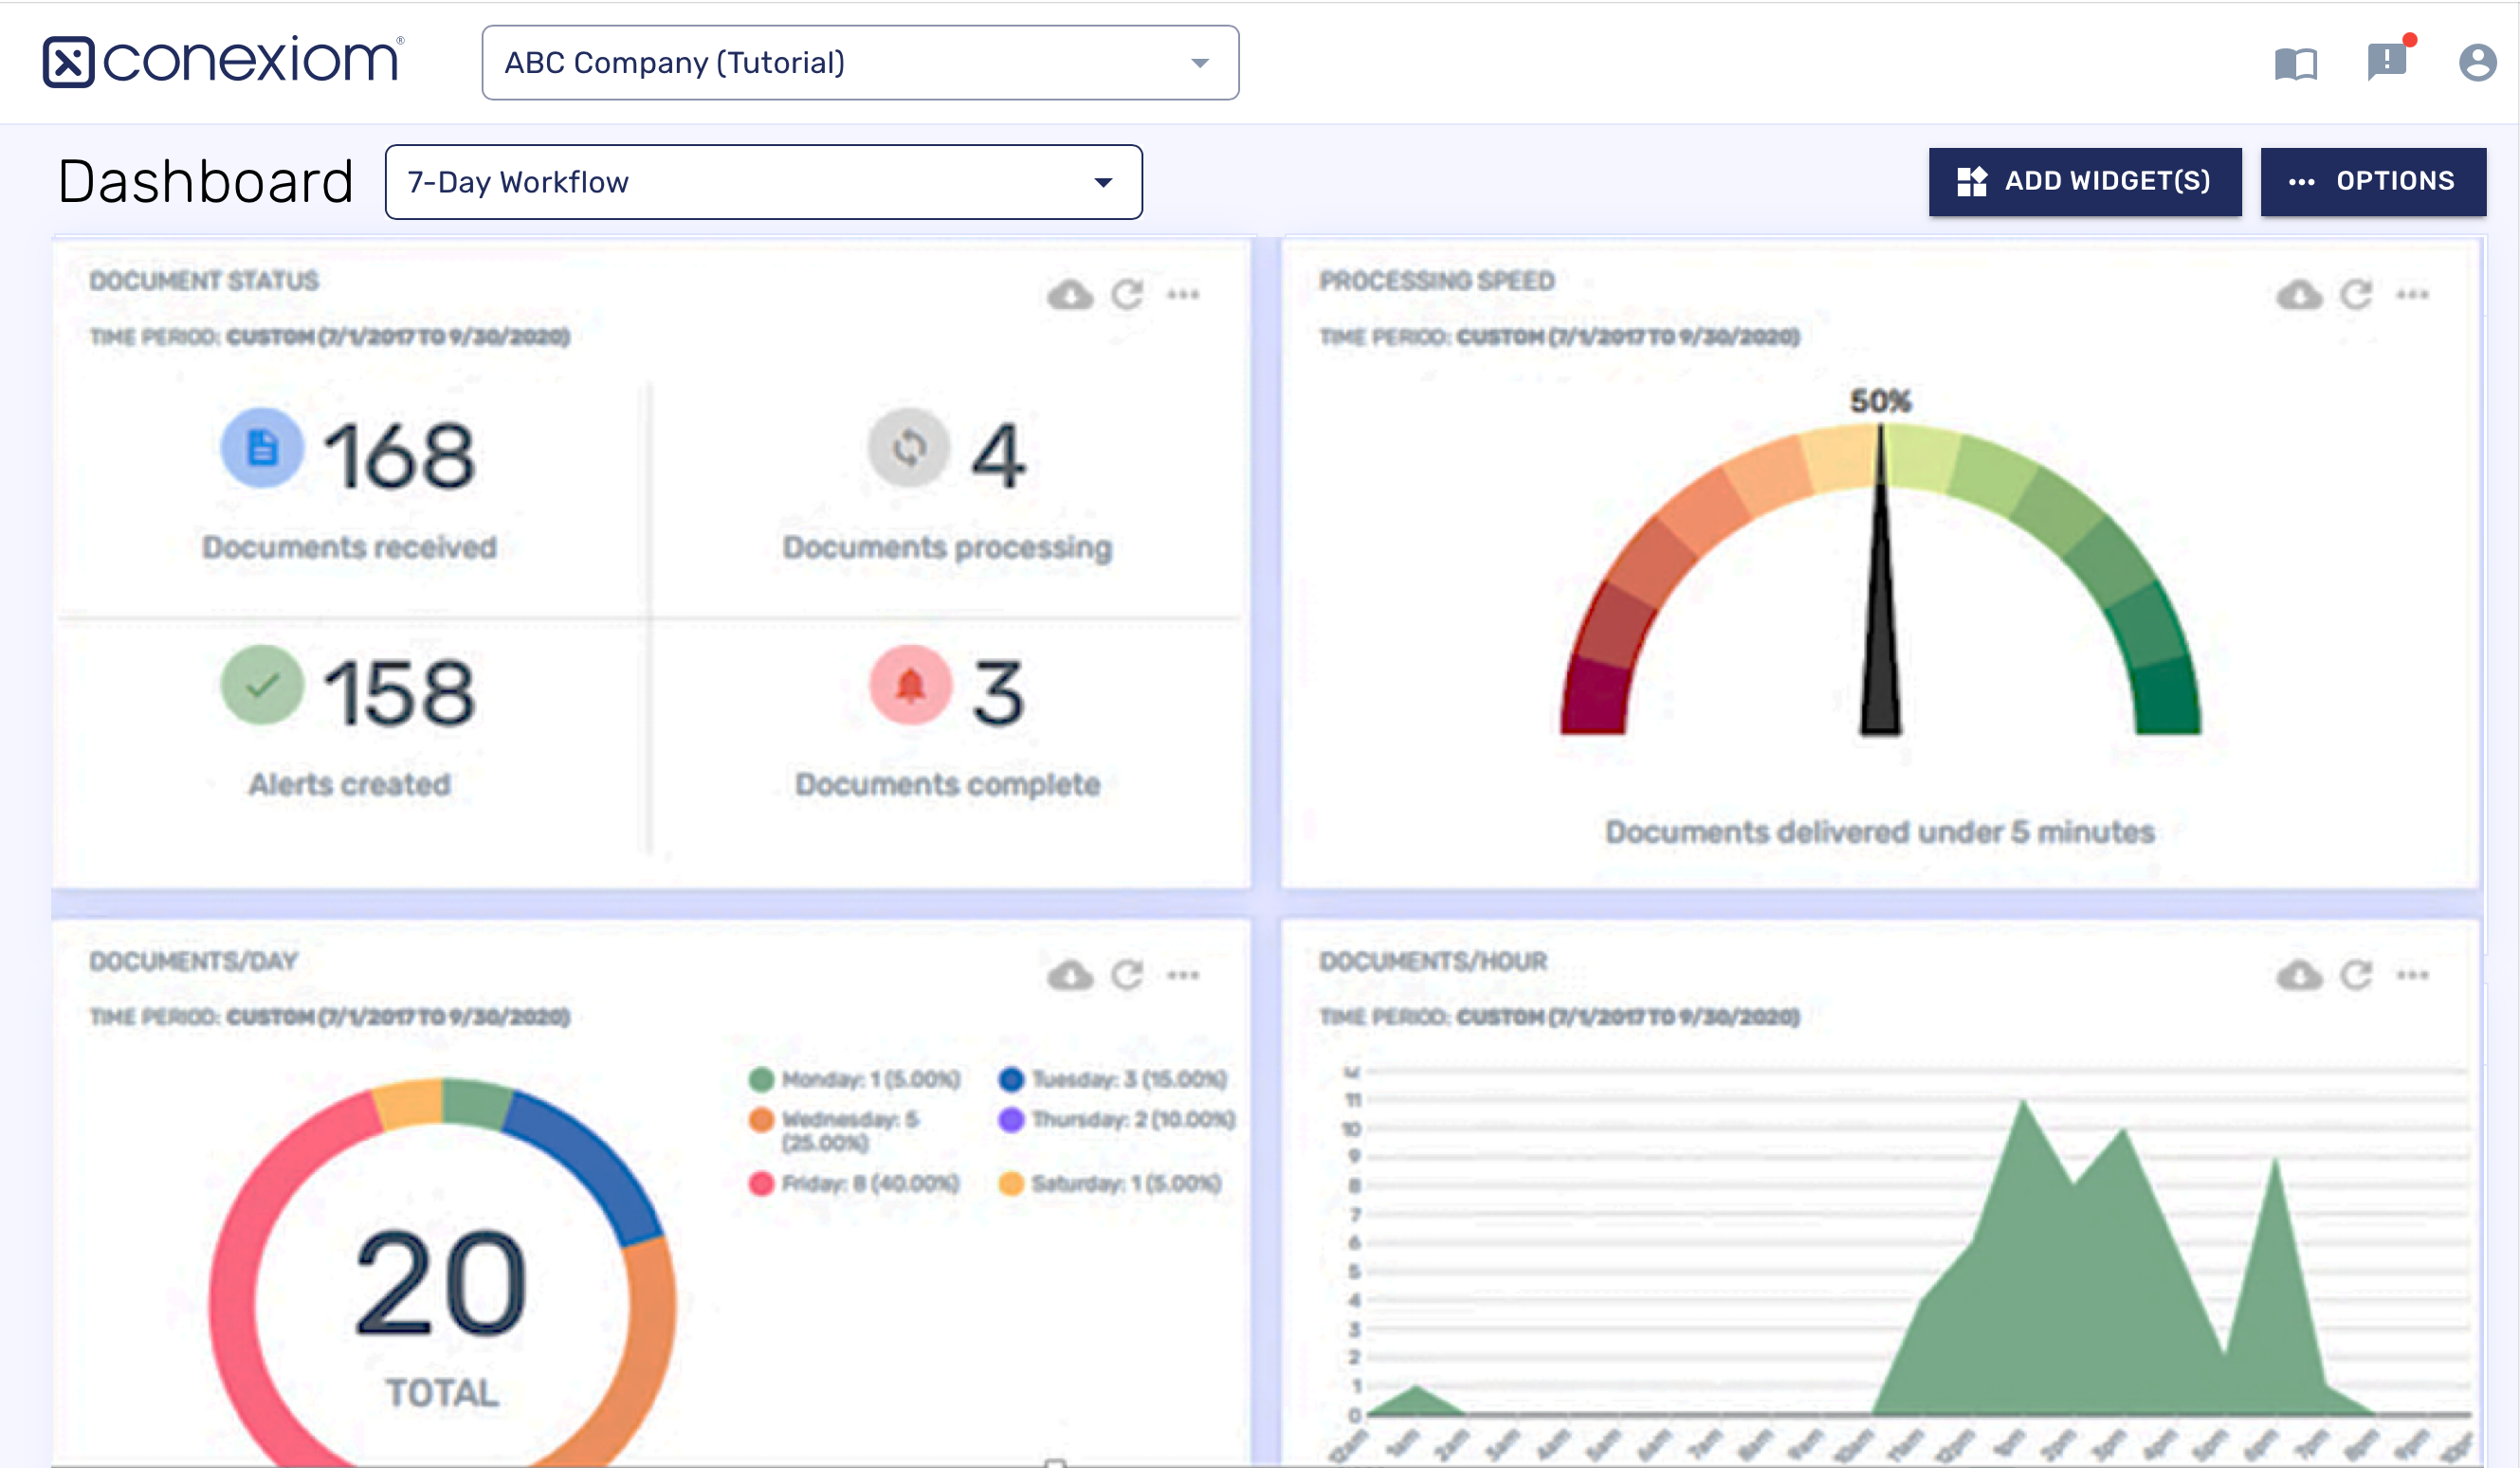
Much of the Dashboard page is comprised of statistical graphs. These are created by small, focused applications called widgets that gather and display data according to set criteria. The widgets display in rectangular panels.
You can drag and drop the different panels to customize the Dashboard, as well as add new and modify existing widgets from this tab.
A number of controls on the screen provide menus or other controls to enable this customization. They include the following:
-
Dashboard Selection Menu
-
Add Widgets Button
-
Options Button
Each of the customization processes are linked below.
Reports Tab
Like the Dashboard tab, The Reporting tab is a source of information on your operations. Run reports to check inbound documents and received emails from the Reporting page within the Conexiom Portal.
Document Report
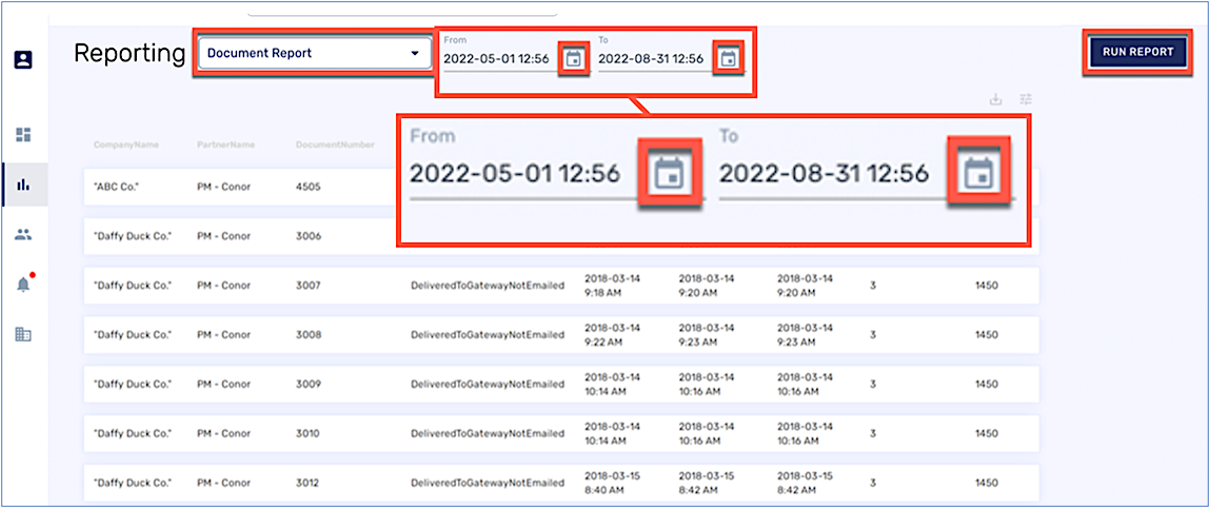
The Document Report shows all documents that you have received within a set period of time. To run this report, follow these steps:
-
From the Report Selection field, select Document Report.
-
Click the Calendar icons to define the time period on which to report.
-
Click Run Report. The system runs the report and then lists it on your screen.
-
Click the listing to open the Document Details page. You can download the report in a csv or xlsx file by clicking on the download icon in the top right corner.
Emails Received Report
The Emails Received Report shows all of the emails that you have received within a set period of time. To run this report, follow these steps:
-
From the Report Selection field, select Email Report.
-
Click the Calendar icons to define the time period on which to report.
-
Click Run Report. The system runs the report and then lists it on your screen.
-
Click the listing to open the Document Details page. You can download the report in a csv or xlsx file by clicking on the download icon in the top right corner.
Leveraging the Dashboard and Reports
You can add, duplicate, edit, or delete dashboards. The data the dashboard is using is also available for download. You can add, edit, delete, and move widgets, or you can download the widget’s data. And you can use a number of tricks and tips to leverage the Dashboard and Reports for current operational information about the performance of your account. To see more, follow the links below: