Adding a Widget
To add one or more widgets, follow these steps:
-
Click Add Widget(s). The Add Widget(s) dialog displays.
-
In the dialog, find a widget you would like to add by using one of the following methods:
-
With your mouse, scroll to browse for the widget based on the description within the name.
-
In the Search Widget field, enter a name or key word to search for the widget you want. Default Widgets include the following:
Average Document Total Customer Status
Average Lines
Top Inactive Customers
Documents/Day
Processing Speed
Documents/Hour
Top Customers by Alert
Document Status
Top Customers by Amount
Customer Implementations
Top Customers by Documents
Top Customers by Lines
Total Alerts
Total Amount
Total Documents
Total Lines
-
- Click Add for each widget you want.
- Click Add Widget(s). The widgets you selected display in the dashboard. You can now customize the widgets you added.

Editing a Widget
You can edit any widget to customize it. Follow these steps.
Click the Gear icon in the top, right corner of the widget. The Widget Settings dialog displays.
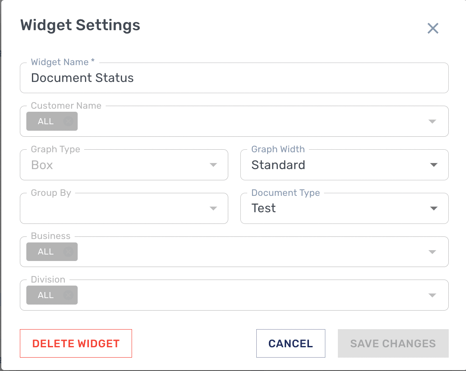
Enter or select appropriate information into each field according to the table below:
|
Field |
Description |
|
Widget Name |
The Widget settings dialog provides a text box to edit the name which appears in the Dashboard. This is useful when a Dashboard contains multiple widgets of the same type |
|
Customer (or Vendor) Name |
The Customer Name filter allows for the selection of multiple customers. Once confirmed, the widget will only present data related to the customers selected in this filter. |
|
Graph Type |
See Example Graphs, directly below this table. |
|
Graph Width |
There are two options for the graph width: standard and wide. Standard graphs will take up to 50% of the Dashboard width. Wide graphs will take up to 100% of the Dashboard width. The wide option is useful for presenting data across larger time periods. |
|
Rotate Labels |
There are two options for the Rotate Labels setting: Yes, and No. Selecting Yes will rotate the x-axis to 45 degrees. This prevents any label overlap for graphs which contain many points on the x-axis. Selecting No writes out the x-axis labels horizontally. [rewrite ?] |
|
Group by |
The group-by option will set which intervals to appear on the X-axis. Widgets can be set to present data by hour in the day, day in the week, day, week, month, quarter, and year. |
|
Document Type |
There are two document types in the portal, Test and Production. Widgets can be set up to present data for one or all document types. |
|
Business |
The business filter allows the selection of multiple businesses. When confirmed, the widget will only present data related to the selected businesses. |
|
Division |
The division filter allows the selection of multiple business divisions. When confirmed, the widget will only present data related to the selected divisions. |
Example Graphs
 |
 |
 |
 |
 |
 |
 |
 |
Deleting a Widget
To delete an existing widget, follow these steps:
Click the Gear icon on that panel.From the dialog that displays, click Delete Widget.
The Widget is deleted from the panel and the dashboard.
Downloading Data from a Widget
To download the data an existing widget, follow these steps:
Click the Download icon on that widget’s panel. A dialog displays.
Your computer downloads the data in an XLXS file.